Aug 05, 2022
Rooftop Solar Benefits All Electricity Customers, Even Ones without Solar
New research conducted by Secure Futures challenges the myth spread by electric utilities that rooftop solar only benefits solar customers at the expense of all other ratepayers. The truth is actually the opposite — distributed solar helps everybody on the grid. Our findings show that solar owned by electric power customers consistently reduces peak demand for all utility customers, even those without solar power.
This post is a summary of an article by our President and Co-Founder Tony Smith and our Project Coordinator Andre Eanes published in the June 2022 issue of Solar Today magazine.
As a solar developer, Secure Futures has access to detailed energy data from utility meters and the solar arrays that we own and operate. This has allowed us to conduct in-depth analyses into the performance of these systems, demonstrating that commercial solar PV generation installed “behind the meter” (ie, benefiting the customer directly) consistently offsets peak demand for both customers and the grid as a whole.
While solar is intermittent, it is predictably intermittent such that it can reliably offset customer and utility peak demand – so reliable, in fact, that it is comparable to adding battery storage, which is why we refer to this phenomenon as “Virtual Solar Storage.”
Challenging Anti-renewable Myths
There is common myth perpetuated by utility companies and fossil fuel lobbyists that because solar is an intermittent daytime resource, due to passing cloud cover, that solar requires full back-up by nuclear, coal and natural gas generation plants, which adds extra expense for all ratepayers any time solar power is installed by any ratepayer for their own use. Using this argument, utility company lobbyists urge policymakers to roll back public incentives for solar (ignoring the massive subsidies that keep fossil fuels afloat), calling on government to allow “market forces” to support “all of the above” energy sources, particularly including nuclear and fossil fuel generation.
Along with this is the argument that existing policies such as net-metering and federal tax incentives, intended to level the playing field for solar, represent a subsidy from households and businesses who don’t go solar (especially low-income families who can’t afford to buy solar panels) to those homeowners and business who do go solar, presumably, those with more wealth.
In this way, utility lobbyists claim that poor people have to pay higher taxes and higher utility rates to subsidize solar panels for rich people and profitable businesses.
Those higher utility rates allegedly come from the need for utilities to build extra fossil fuel and nuclear plants to back up solar. After all, the sun doesn’t always shine, but the power always needs to be on.
A commonly cited solution to the solar intermittency issue is battery storage. Batteries have made great progress over the last few years, getting bigger and cheaper at the same time. But improvement in batteries may stall for the next few years. Current battery technologies require far more rare earth metals than solar panels, placing greater reliance on exploitative mining practices that disproportionately occur in the global South. Additionally, battery storage is not as economically established as solar and is heavily reliant on manufacturing in China, which is already constrained in refining raw material for the majority of the world’s lithium-ion batteries.
In the future, batteries are sure to keep improving. But for now, batteries remain too expensive for many applications. That’s where virtual batteries, provided by solar panels themselves, could step in.
Our Research Methodology
Our analysis covered a diverse selection of Secure Futures’ summer daytime peaking commercial customers who stood to benefit the most from peak demand reduction by solar (“Qualifying Customers”). This included three separate public-school facilities, two cold storage facilities, one hospital, and two university facilities. The facilities are all located in the state of Virginia, but they’re served by four different utilities.
For each facility, we matched 12 months of utility interval data with solar production data to determine what their energy consumption profile have been without solar. The key metrics for solar performance included reductions during customers’ monthly peak demand and the five summertime coincident peak (5CP) times, the latter of which are times of expensive peak generation for utilities connected to the Mid-Atlantic electric grid known as PJM.
Results of Our Analysis
Two groups stand to benefit in different ways from these findings: commercial solar customers and their utilities (which would include all non-solar customers). Benefits to commercial solar customers center around the reduction in peak demand billed from the utility, while non-solar participants can theoretically save money due to reduced need for higher cost peaker-plant generation. The consistency and reliability of these demand reductions benefits all stakeholders.
Customer Peak Demand Reduction
Peak demand reduction by solar varied depending on the size of the array at each facility. These offsets averaged 25% of peak demand during the summer and 22% of peak demand annually across all facilities.
The percent peak demand offset by facility is shown in Figure 1.
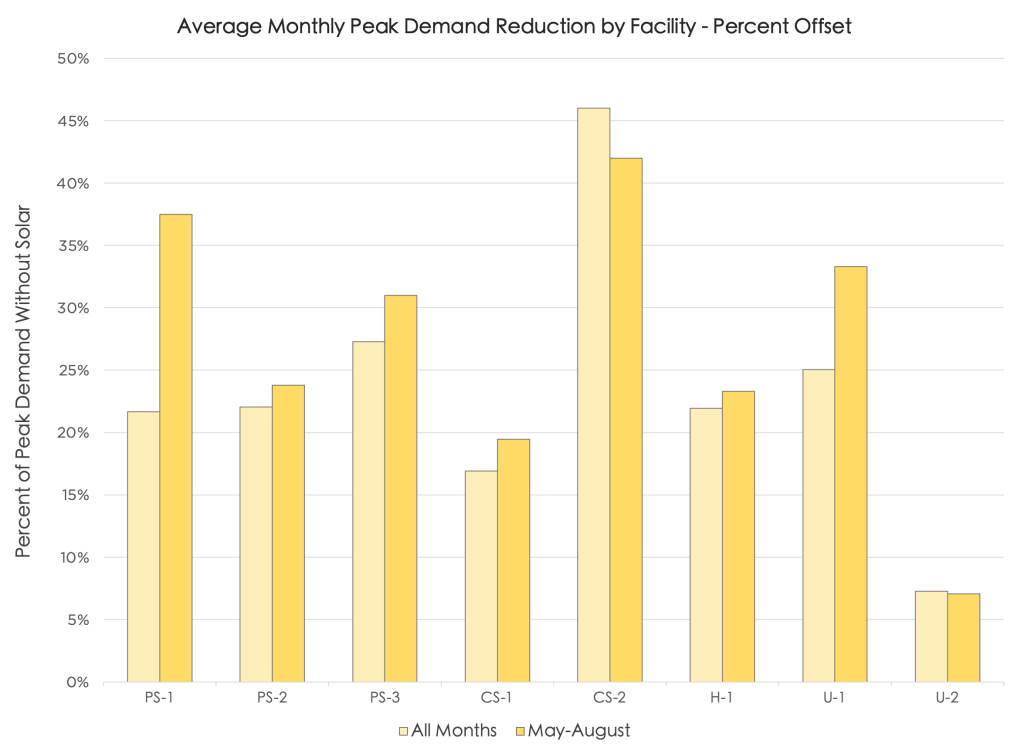
This shows that solar peak demand reduction is primarily driven by the capacity of the array, which is often limited by available rooftop or land area. It also emphasizes importance of implementing our company’s approach to optimizing the size of solar arrays (big enough to matter but not bigger than you need to get maximum economic value), Resilient Solar Right-Sizing™, wherever possible, as discussed later.
Additionally, variations in peak demand reduction may also reflect occasional spikes in customer demand and occasional dips in solar production. However, these dips in coverage are not consistent enough to reduce the reliability of a properly right-sized system in predictably offsetting peak demand.
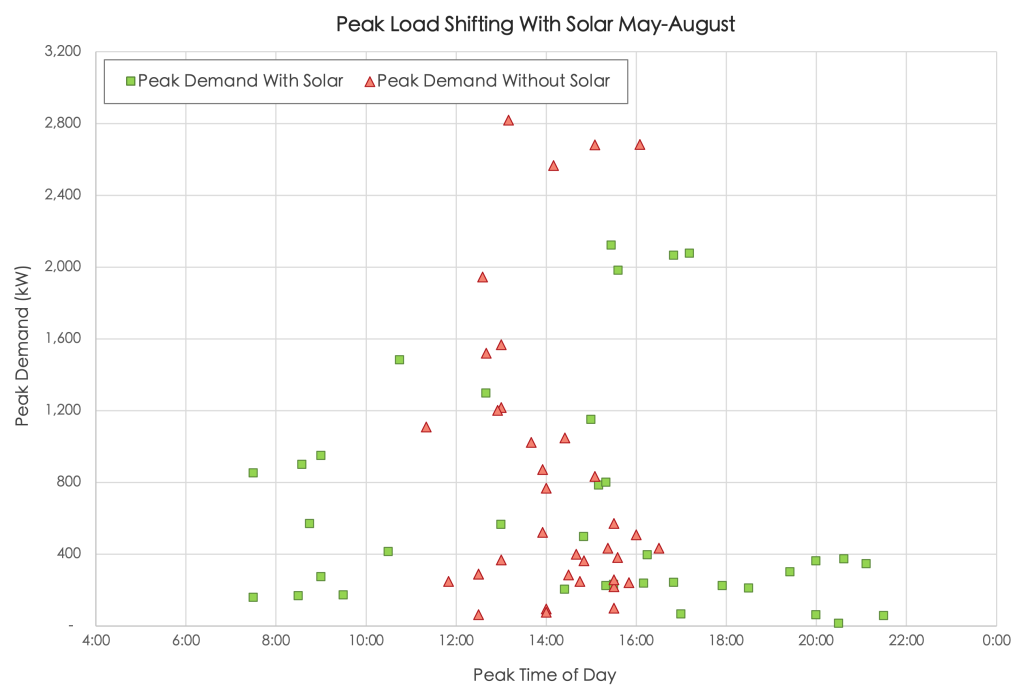
Customer Peak Load Shifting
Facilities with solar that we examined saw far fewer demand during mid-day hours due to peak load shifting. While this can vary due to system size and customer consumption, 85% of months analyzed saw a shift in peak load away from the afternoon, meaning it occurred much later in the day or earlier in the morning .
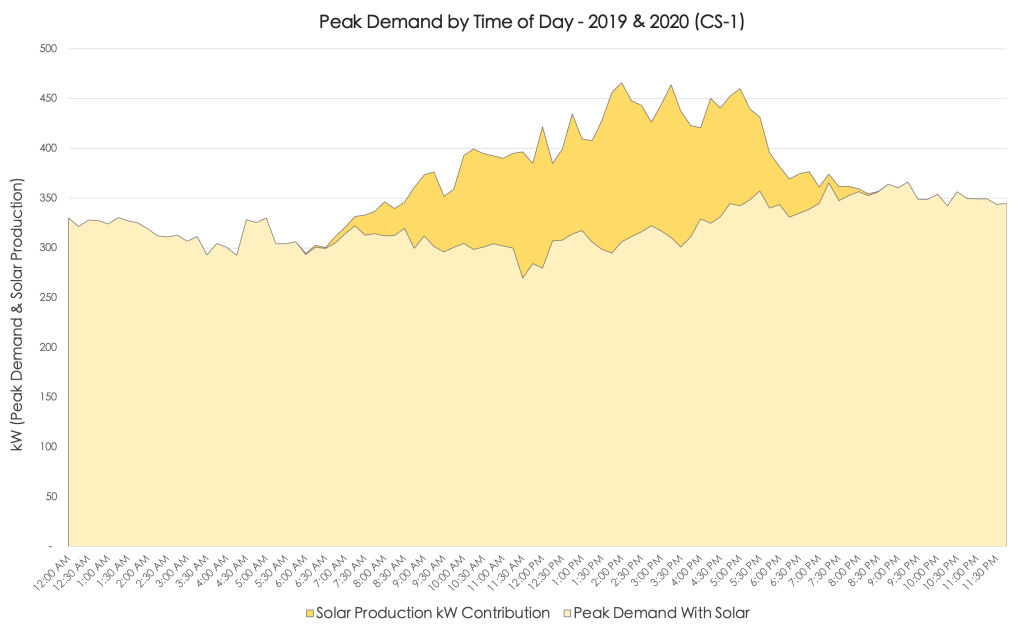
Figure 2 shows this pattern for all facilities, and Figure 3 shows an example time-of-day view of peak demand reduction.
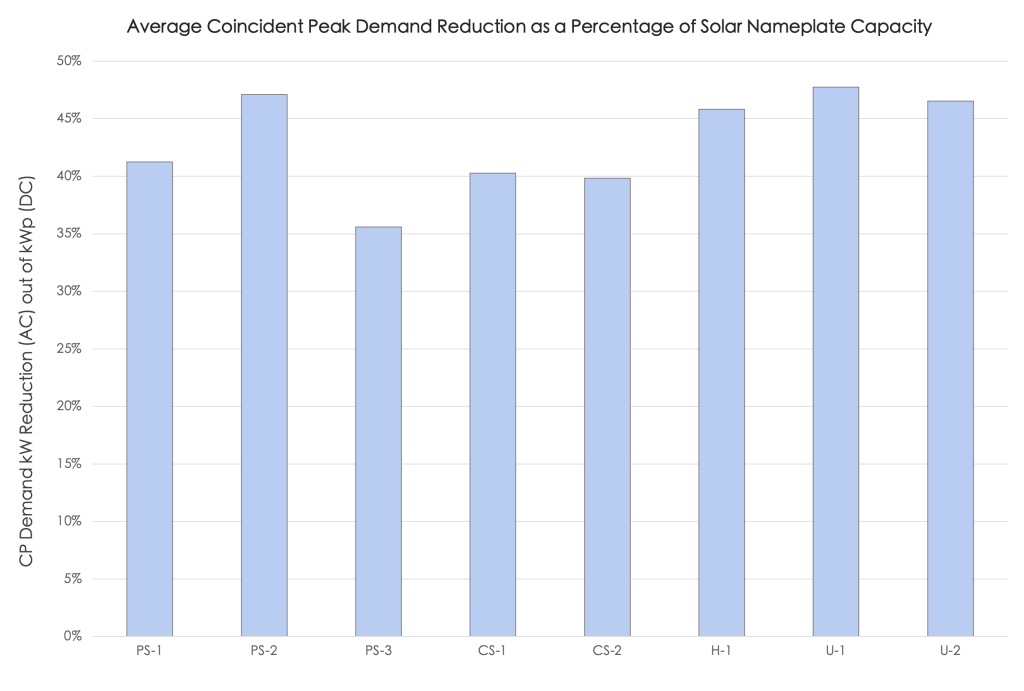
Customer Peak Demand Reduction as a Percentage of Solar Nameplate Capacity
Nameplate capacity (kWp) is the theoretical maximum Watt output of a solar array in optimal conditions, representing the standard metric for the scale of a solar project. This comes into play when trying to quantify the performance of an array. While it is more tangible for customers to think of solar performance directly in terms of demand reduction they see, this does not account for varying system sizes.
By dividing peak demand kW reduction by nameplate capacity of the array, we can control for this and derive a more objective measure of system performance, regardless of the overall scale of the project and limitations on system sizing.
Figure 4 shows this for all eight facilities analyzed.
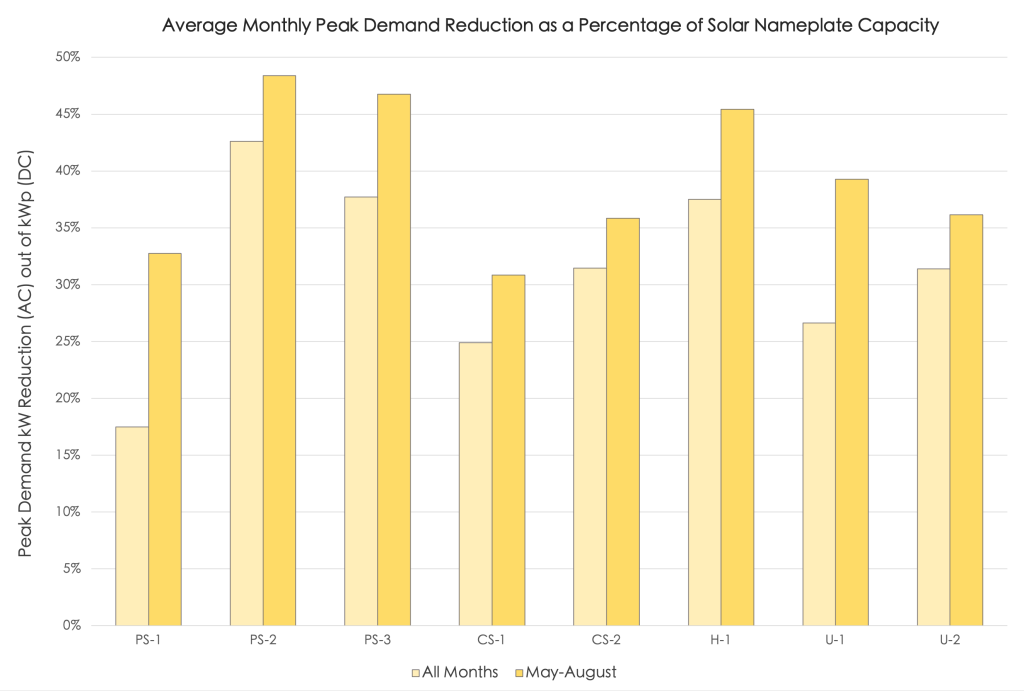
Solar peak demand reduction as a percentage of kWp DC was greater in the summer months (43% on average) for all facilities than overall for the year (34% on average). This stands to reason given the higher expected output during summer months relative to the constant standard that is nameplate capacity.
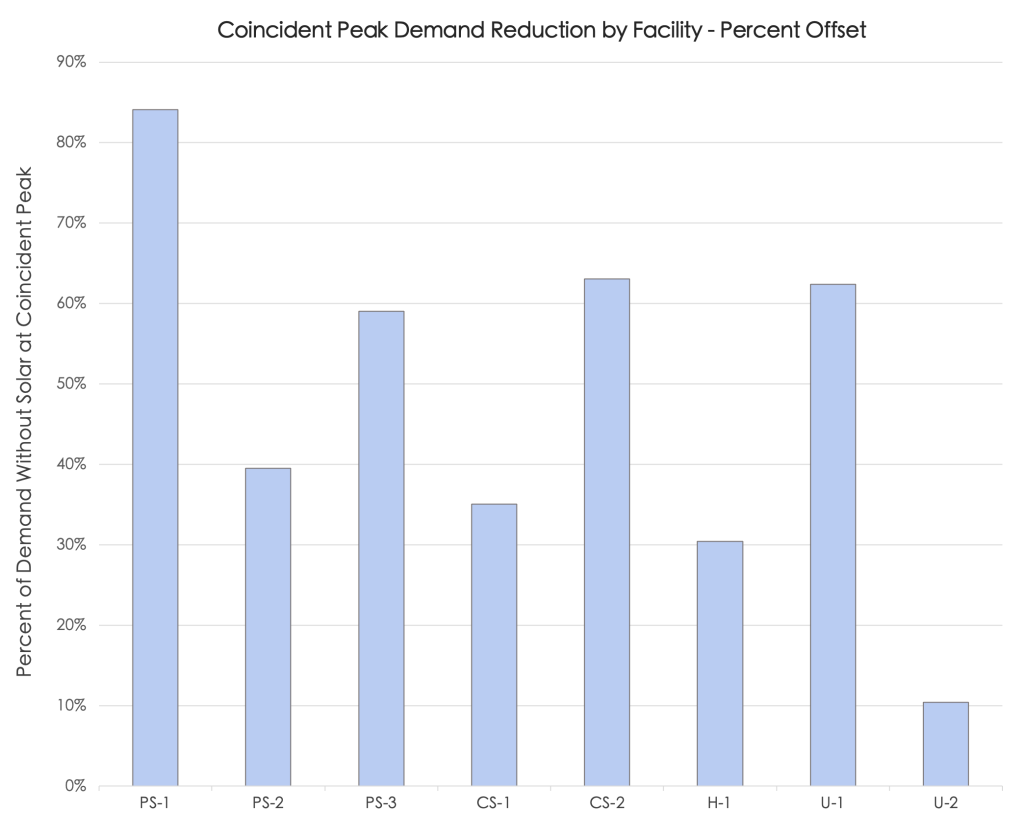
Utility Coincident Peak Demand Reduction
As with customer peak demand reduction, average PJM coincident demand reduction varied by facility depending on system size. However, the average 5CP offset was consistently higher than that of monthly customer peak demand This is likely due to 5CP periods generally occurring during late afternoons in the summer when solar production is relatively high, whereas monthly peak demand could occur during other months and times of day.
This pattern is shown by facility in Figure 5.
Utility Coincident Peak Demand Reduction as a Percentage of Solar Nameplate Capacity
Like with peak demand reduction, solar offsets to coincident peak demand are best represented as a percentage of nameplate capacity. 5CP demand reduction as a percentage of kWp DC ranged between 36% and 48% (averaging 44%), which is actually more consistent than the same metric for peak demand reduction.
This spread is shown in Figure 6 below.
This demonstrates that, given sufficient adoption and interconnection with the grid, solar can consistently reduce coincident peak demand for energy utilities and alleviate overall strain on the grid. Based on these findings, all rate payers can benefit from solar as a result of their utilities saving on peak generation and grid upkeep, whether or not customers have solar on their roofs.
Implications on Solar “Right-sizing”
On top of reshaping policy, these findings can revamp our approach to sizing solar arrays for this class of qualifying customers. This comes from the peak shaving potential via Virtual Solar Storage (as opposed to focusing solely on kWh usage reduction) in order to capture the highest dollar savings per installed Watt of solar. Lastly, this framework provides reason for public entities and policy-makers to make more informed decisions about how to leverage solar as an important component of a smarter, diversified, and more resilient energy grid.
For best results with peak demand shaving by solar, facilities should be summer- and daytime- peaking. In the northern hemisphere (as all facilities we analyzed are), we define summer-peaking as having the greatest monthly peak demand (before solar) between the months of May and August. Daytime-peaking is defined as having demand regularly peak between 11:00 AM and 4:00 PM with few to no demand spikes during off-production hours. All facilities reported in this analysis met these criteria.
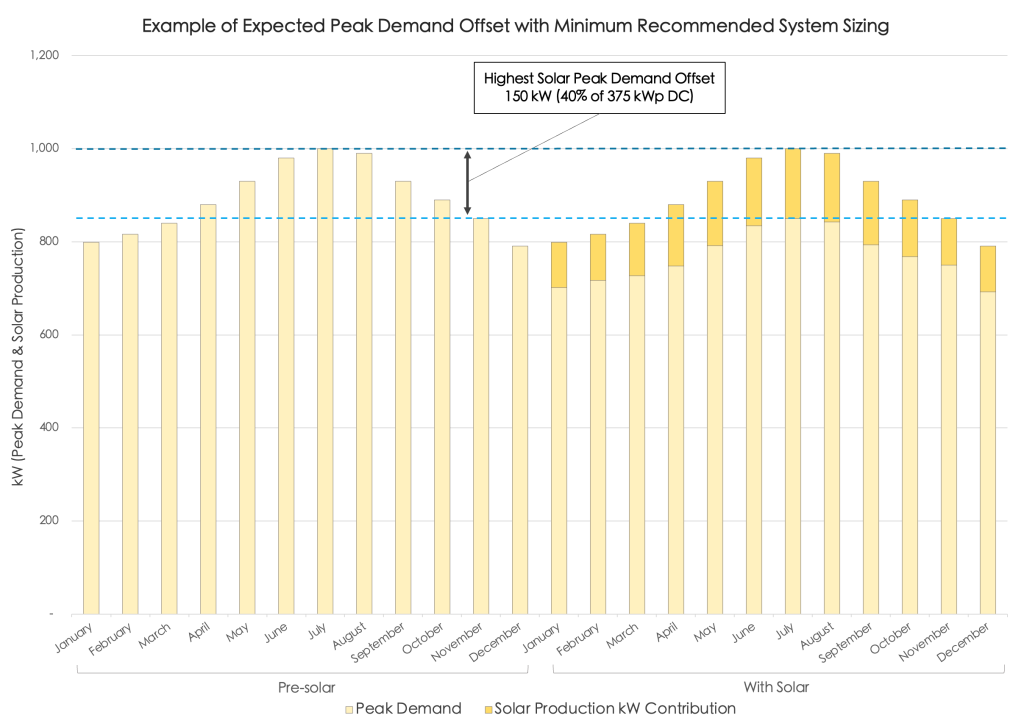
Given that the average May-August demand offset out of kWp DC for the eight facilities analyzed is 43% (as shown in Figure 4), a realistic baseline of summer peak demand reduction would equal at least 40% of kWp DC in most cases. This is on par with actual system performance and is used as the level of summer peak demand reduction in Figures 7 and 8 below.
At minimum, arrays should ideally be sized such that solar can offset the difference between summer (May-August) and winter (November-February) pre-solar peak kW. This is because, even in a worst-case scenario of winter solar production, peak demand can expect to remain below pre-solar winter peak levels.
This sizing is shown in Figure 7.
With larger systems, solar production can even shift the annual demand peaks to winter months as shown in Figure 8, depending on the prominence of summer pre-solar demand peaks.
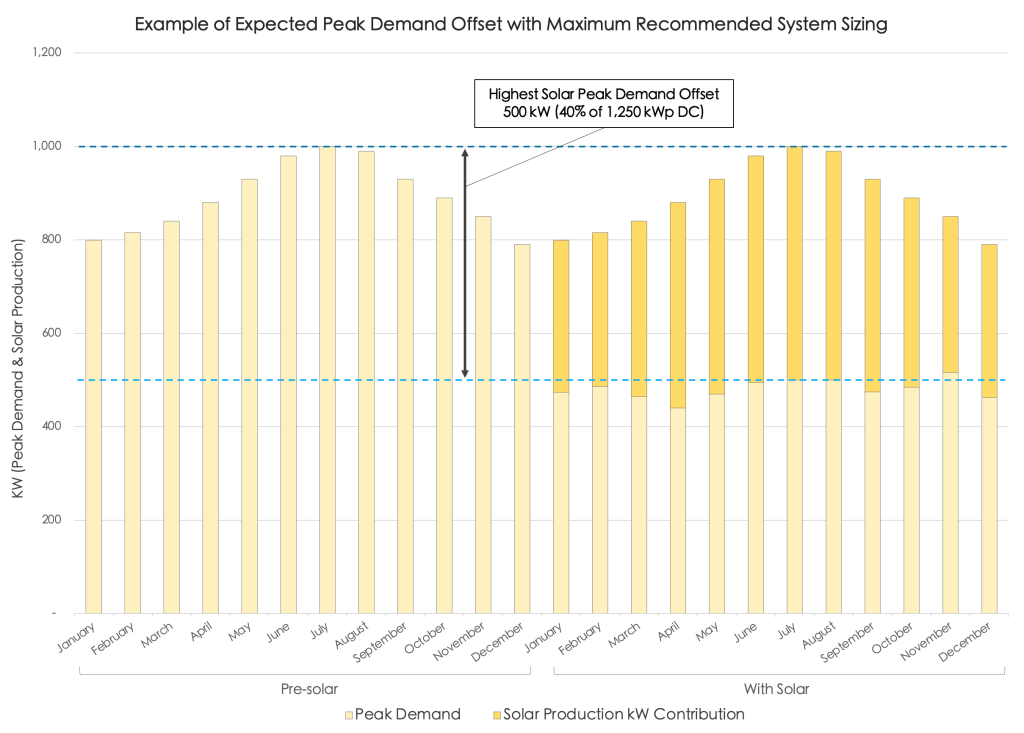
In the cases of both Figures 7 and 8, the kW reduction equaled 40% of their nameplate capacities. Right sizing for a 15% to 50% reduction of pre-solar peak demand falls between the lower range for project economies of scale and the higher limit for Virtual Solar Storage.
Ultimately, it is important to note that larger systems (especially those offsetting more than 100% of kWh annually) eventually see diminishing returns in terms of both peak demand offset and financial savings. Since KW demand costs often represent the most valuable part of the electric bill, any additional solar generation that does not noticeably reduce peak demand represents a diminishing marginal return.
Policy Implications of our Research
Assertions about the supposed unreliability of solar in reducing demand are often proclaimed as fact by the fossil fuel industry and utilities, who retain an outsized influence on energy policy. However, dispelling this myth undercuts lobbying efforts that attempt to leverage historical misinformation and ambiguity on this issue.
As solar captures a larger share of the energy market, the grid must evolve to accommodate solar and other distributed renewables. This means a smarter, more responsive grid and the widespread implementation of bidirectional metering. Under this system, residential and commercial customers can take full advantage of net metering while distributed solar can be dispatched onto micro- and macro-scale grids as needed.
Finally, regulations must be put in place to properly redistribute financial savings from demand reduction by solar (and a more efficient grid overall) that can be realized by utilities. Unless required to do otherwise, investor-owned utilities have more incentive to internalize these savings rather than pass them onto rate payers, especially when they retain an effective monopoly on the market. Once the necessary infrastructure is in place, this is the most critical step in dispelling the myth that non-solar rate payers subsidize solar customers.
Suggestions & Areas for Future Research
One important area of future research surrounds the mid- to long-term implications of solar development and its impact on grid-scale load shifting. At a certain point, solar may carve out the duck curve beyond what the grid can handle. Is there a saturation point of solar’s market share, assuming it is not paired with storage? What does solar fulfilling a “Virtual Solar Storage” niche look like for the grid as a whole?

Future research into solar Right-sizing is essential in building industry knowledge in how to design arrays to suit differing conditions. Customers with a wide variety of demand profiles can still benefit from solar, and long-term research can help to inform and to best adapt solar design to provide the most value for them and all stakeholders.
Another topic of research could address the financial implications of stranding fossil fuel assets such as coal plants to adopt a more diversified grid made up of solar among other renewables. Considering environmental costs and the privatized ownership of fossil fuels, it is quite possible that transitioning to renewables before fossil fuel assets have completed their life cycle could still be more economically beneficial overall.
Lastly, public entities that issue requests for proposals (RFPs) for solar projects should give greater consideration to the benefits of peak demand reduction. Currently, standard practice is to only consider savings from kWh usage offset and assume that savings on demand charges will be negligible, but this analysis refutes that claim.
About the Authors

Andre Eanes serves as Project Coordinator for Secure Futures. He conducts technical analysis and market research with the goal of creating a more sustainable and equitable future. He received his BS in biology from the University of Richmond and is an FAA certified commercial drone pilot.

Anthony Smith, PhD, serves as President and Founder of Secure Futures. He brings over 40 years in developing and leading innovative solutions in energy efficiency and solar, with emphasis on creative financing to make energy more affordable for public serving entities. In a previous life he traded oil futures to hedge energy costs for commercial customers, and now applies those skills sets in hedging energy costs with solar. He received his PhD from the Wharton School of Management, University of Pennsylvania.
References
Lippeatt, J.D., Pforzheimer, A., Huxley-Reicher, B. Blocking Rooftop Solar: The companies, lobbyists and front groups undermining local clean energy. (Report) The Public Interest Research Group, 2021. https://bit.ly/3Jk8bAW
Brown, D.P., & Sappington, D.E.M. (2017). Designing Compensation for Distributed Solar Generation: Is Net Metering Ever Optimal? The Energy Journal, 38(3). https://doi.org/10.5547/01956574.38.3.dbro
Babacan, O., Ratnam, E. L., Disfani, V. R., & Kleissl, J. (2017). Distributed energy storage system scheduling considering tariff structure, energy arbitrage and solar PV penetration. Applied Energy, 205, 1384–1393. https://doi.org/10.1016/j.apenergy.2017.08.025
Mineral requirements for clean energy transitions. IEA, 2022.https://bit.ly/3lkSNum
Bhutada, Govind. Ranked: Top 25 nations producing battery metals for the EV supply chain. Mining.com, 2021. https://bit.ly/3MunXvl
Sunar, N., & Swaminathan, J. M. (2021). Net-Metered Distributed Renewable Energy: A Peril for Utilities? Management Science, 67(11), 6716–6733. https://doi.org/10.1287/mnsc.2020.3854
U.S. Department of Energy (US DOE), Office of Energy Efficiency and Renewable Energy (EERE). Confronting the Duck Curve: How to Address Over-Generation of Solar Energy.Accessed on April 15, 2022. https://bit.ly/3OycmNp